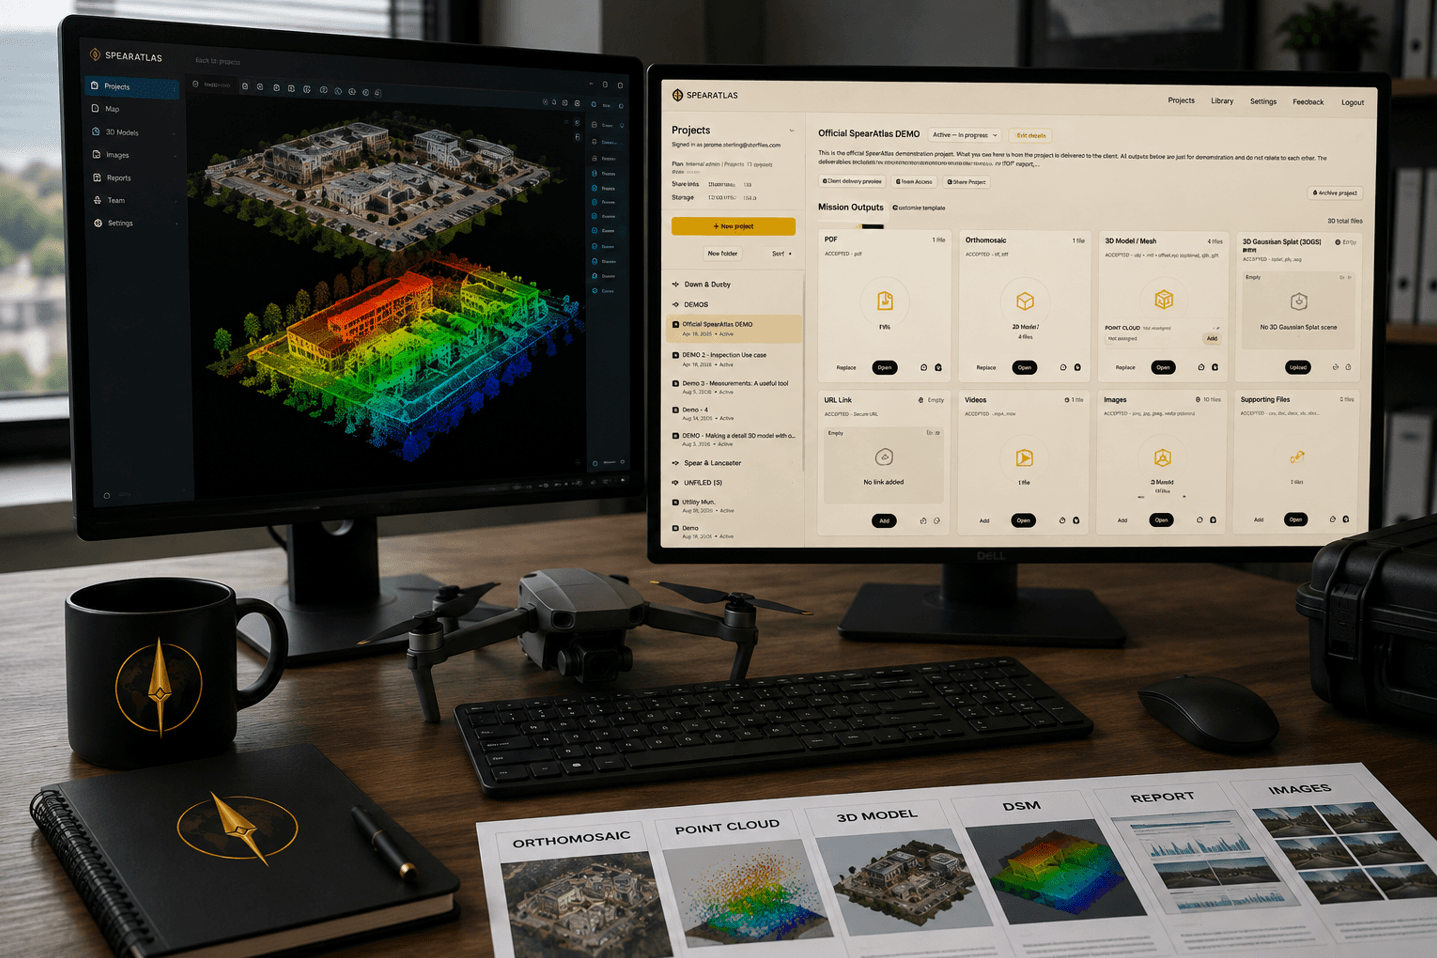
Drone mapping rarely produces just one file.
A single mapping mission can result in an orthomosaic, point cloud, elevation model, textured 3D model, photographs, reports, control information, and several supporting files.
For experienced mapping professionals, those outputs are familiar. For clients, project managers, contractors, and even newer drone operators, the collection can be confusing.
Understanding what each deliverable contains is important because each file serves a different purpose. A GeoTIFF is not interchangeable with a point cloud. A textured 3D model is not the same thing as an elevation model. A beautiful visualization does not necessarily provide the same measurement value as the underlying spatial data.
This guide explains the most common drone mapping deliverables and where each one fits into a professional project.
Why drone mapping produces multiple deliverables
Photogrammetry begins with overlapping photographs.
Software identifies common features across those photographs and uses their changing positions to reconstruct the geometry of the site.
From that reconstruction, several different products can be generated.
Think of the processed project as a spatial dataset rather than a single map.
One client may only need an interactive overhead view.
A civil engineering team may want the point cloud.
A construction manager may primarily use the orthomosaic and progress imagery. Drone mapping for construction covers that jobsite use in more detail.
A visualization team may prefer the textured 3D model.
The appropriate deliverable depends on what someone needs to do with the information.
Orthomosaic
An orthomosaic is one of the most recognizable drone mapping deliverables.
Hundreds or thousands of overlapping photographs are combined into one corrected overhead image.
Unlike a normal aerial photograph, an orthomosaic is designed to represent the site from a consistent top down perspective and can be georeferenced to a coordinate system.
This allows the image to behave much more like a map.
Common uses include:
- Site documentation
- Construction progress comparison
- Property and land visualization
- Distance and area measurements
- Asset location
- Site logistics
- Inspection context
- GIS reference layers
Orthomosaics are commonly exported as GeoTIFF files when geospatial information needs to remain attached to the image.
If you are unfamiliar with the underlying product, read the SpearAtlas guide explaining what an orthomosaic is.
GeoTIFF
GeoTIFF describes a file format rather than a specific mapping product.
A TIFF image can contain embedded geographic information describing where the image belongs in the real world.
That geographic information can include the coordinate reference system, map position, pixel scale, and other spatial metadata.
Orthomosaics are frequently delivered as GeoTIFF files.
Digital surface models and digital terrain models may also be delivered using GeoTIFF because each raster pixel can represent an elevation value rather than a color.
This distinction matters.
Two files can both end in TIFF while representing very different information.
One may contain aerial imagery.
Another may represent surface elevations.
The filename, metadata, project documentation, and delivery structure should make the difference clear.
A GeoTIFF can also be structured as a Cloud Optimized GeoTIFF so compatible software can request only the parts of a large raster needed for a given view. That organization does not change what the pixels represent. GeoTIFF vs Cloud Optimized GeoTIFF covers when that structure matters.
Point cloud
A point cloud represents a site using a large collection of individual three dimensional points.
Each point contains a position in space, normally represented by X, Y, and Z coordinates.
Additional attributes can include color, classification, intensity, or other information depending on how the cloud was created.
Photogrammetry can generate dense point clouds by reconstructing surfaces visible across overlapping photographs.
LiDAR systems can also generate point clouds, although the capture method is fundamentally different.
Point clouds are useful for:
- Three dimensional measurements
- Surface analysis
- Cross sections
- Volume calculations
- Existing condition documentation
- Engineering workflows
- CAD and BIM reference
- Terrain analysis
- Asset documentation
The tradeoff is complexity.
A dense point cloud may contain millions or billions of points and can become much more difficult for a client to open than a photograph or PDF.
That is why professional delivery often includes both the native point cloud and an easier browser based method for initially reviewing the project.
For a deeper explanation, see the SpearAtlas guide on what a point cloud is.
LAS files
LAS is one of the most established file formats for point cloud data.
It was designed specifically for storing three dimensional point information.
LAS files can contain coordinates along with attributes such as classification, return information, color, and other point metadata.
Many GIS, surveying, engineering, and point cloud applications understand LAS.
The disadvantage is file size.
Dense mapping projects can produce very large LAS files.
That leads directly to another format commonly encountered in professional mapping.
LAZ files
LAZ is a compressed representation of LAS point cloud data.
The goal is to preserve the point information while significantly reducing storage requirements.
For large projects, the difference can be substantial.
A mapping professional may therefore keep or deliver LAZ instead of an uncompressed LAS file when compatible downstream software is available.
From the client's perspective, the important distinction is simple.
LAS and LAZ normally represent point cloud data.
LAZ uses compression to make that information easier to store and transfer.
Whether the client needs LAS or LAZ should be discussed before final delivery if the data is entering a specific engineering or GIS workflow. LAS vs LAZ covers compression, compatibility, and why a smaller file is not the same as a simplified cloud.
Digital Surface Model
A Digital Surface Model, commonly called a DSM, is a raster representation of elevation.
The important word is surface.
A DSM generally represents the elevations of surfaces visible to the capture system.
On a construction site this may include:
- Ground
- Buildings
- Stockpiles
- Equipment
- Vegetation
- Trailers
- Other visible objects
Each raster cell represents an elevation value.
A DSM can support drainage visualization, surface analysis, volume workflows, terrain understanding, and other spatial calculations.
However, it should not automatically be interpreted as bare earth terrain.
Trees, buildings, and other objects may remain part of the surface. DSM vs DTM vs DEM explains how those surfaces differ from terrain models and from the broader DEM label.
Digital Terrain Model
A Digital Terrain Model, commonly called a DTM, attempts to represent the underlying terrain rather than every visible surface.
Creating a reliable terrain model may require classification and removal of vegetation, structures, equipment, and other objects.
The quality of that process depends heavily on the source data and the environment.
Photogrammetry cannot photograph ground that it cannot see.
Dense vegetation therefore creates an important limitation.
A mapping product should never be treated as accurate bare earth simply because its filename contains DTM. DSM vs DTM vs DEM covers why photogrammetry cannot invent ground the camera never saw.
The methodology used to create the product matters.
DEM
Digital Elevation Model is a broader term describing digital representations of elevation.
Depending on the software, organization, or industry, DEM may sometimes be used generally while DSM and DTM describe more specific types of elevation surfaces.
This terminology can become inconsistent between platforms.
For client delivery, clarity matters more than assuming everyone uses the terms identically.
If a file represents visible surfaces, say so.
If it represents classified terrain, document how the terrain was derived.
3D mesh
A 3D mesh represents surfaces using connected polygons.
Photogrammetry software can take reconstructed geometry and build a continuous surface across it.
A photographic texture can then be projected onto that geometry.
The result is the familiar interactive 3D reconstruction commonly associated with photogrammetry.
Meshes are excellent for visual communication.
They make it easier to understand:
- Structures
- Excavations
- Roof geometry
- Stockpiles
- Site context
- Facades
- Existing conditions
They are often easier for a nontechnical client to understand than a raw point cloud.
Common formats include OBJ and GLB, although many other 3D formats exist.
A mesh and a point cloud should not automatically be considered interchangeable.
The point cloud preserves individual measured or reconstructed points.
The mesh creates surfaces between geometry.
That makes the mesh particularly useful for visualization while point clouds often remain more appropriate for specialized spatial analysis.
OBJ
OBJ is a long established format for 3D geometry.
Photogrammetry exports may include an OBJ file along with supporting material and texture files.
This is important for delivery because the OBJ alone may not contain everything required for the model to appear correctly.
If textures or material references are separated from the primary model, all required components need to stay together.
Sending only one piece of the package can result in the client opening an untextured or incomplete model.
GLB and glTF
glTF is a modern format designed for efficient transmission and rendering of three dimensional scenes.
GLB packages glTF information into a binary container, which can make a model much easier to move as a single file.
Browser based three dimensional applications commonly work with glTF or GLB because the formats were designed with efficient modern rendering in mind.
For client delivery, fewer dependent files can also make the experience easier to manage.
Gaussian splats
Gaussian splatting represents another type of three dimensional reconstruction.
Instead of presenting a traditional polygon mesh, Gaussian splatting represents the scene using many spatial primitives that reproduce visual appearance from different viewpoints.
The results can look extremely realistic.
Gaussian splats are particularly useful for immersive visualization and communicating how a captured environment looked.
They should not automatically be treated as replacements for survey point clouds, controlled photogrammetry products, or engineering models.
Different representations solve different problems. Point cloud vs 3D mesh vs Gaussian splat is the dedicated comparison of those three 3D deliverables.
SpearAtlas has a separate guide explaining how Gaussian splatting fits into reality capture workflows.
Source photographs
Processed mapping products should not make the original imagery irrelevant.
Source photographs can remain important for:
- Inspection evidence
- Quality control
- Reprocessing
- Close detail
- Historical documentation
- Client reference
- Future analysis
For some projects, delivering every source photograph is unnecessary.
For others, the imagery is part of the contractual record.
The decision should be established in the project scope rather than improvised after processing.
Reports
A professional mapping project often needs a human readable report alongside the spatial files.
A report can document:
- Capture date
- Project area
- Aircraft or sensor
- Coordinate reference system
- Processing methodology
- Ground control methodology
- Known limitations
- Accuracy checks
- Deliverable inventory
- Important observations
The map shows the site.
The report explains how the map should be interpreted.
That distinction becomes particularly important when measurements, comparisons, engineering decisions, or historical records depend on the dataset.
Ground control and checkpoint information
Projects using ground control points or independent checkpoints may also include control information.
That information could include coordinate tables, diagrams, processing reports, residuals, or accuracy summaries.
Not every client needs every processing detail.
However, when positional accuracy matters, the project should contain enough documentation for another qualified person to understand how the mapping product was referenced and checked. Drone photogrammetry accuracy explained explains the difference between ground control, checkpoints, RTK, and GSD. GCPs vs checkpoints in drone mapping covers that distinction in more detail, including residuals and why RTK does not replace independent checks.
Supporting project files
Mapping projects frequently contain information that does not fit neatly into the primary spatial deliverables.
Examples include:
- CSV files
- Spreadsheets
- CAD references
- Site plans
- Field notes
- PDF inspection documents
- Coordinate lists
- Processing reports
- Reference photographs
- Project instructions
These files provide context around the spatial products.
Separating them completely from the mapping project can make the final record harder to understand months later.
Native data versus viewable delivery
One of the most important distinctions in modern mapping delivery is the difference between preserving native data and making the project easy to review.
An engineer may need the original LAZ point cloud.
The project manager may only need to inspect the model.
A client may want to open the orthomosaic without installing GIS software.
Those requirements do not conflict.
Professional delivery can preserve the original downloadable files while also providing an accessible visual layer for normal review. How to share mapping deliverables with a client covers that last mile without replacing the native files.
The objective is not to replace professional software.
It is to avoid requiring every project stakeholder to become a GIS or point cloud specialist simply to understand what was delivered.
Drone operators and surveying and mapping teams run into this as soon as processing is finished.
A practical mapping deliverable package
A typical professional mapping project could contain:
- Orthomosaic
- GeoTIFF source
- Point cloud
- LAS or LAZ source
- Digital surface or terrain model where required
- 3D mesh
- Project photographs
- PDF report
- Control or accuracy documentation
- Supporting files
Not every project requires every product.
A roof inspection, construction progress flight, stockpile survey, land mapping mission, and detailed reality capture project all have different requirements.
Deliverables should follow the purpose of the mission.
Define deliverables before flying
One of the easiest ways to create problems in a mapping project is waiting until processing is finished to decide what the client actually needs.
Before capture, determine:
- What questions the project needs to answer
- What deliverables are required
- What coordinate system is required
- What accuracy level is appropriate
- Who will use the files
- What software those people use
- Whether native downloads are required
- How the project will be reviewed
- How long the information needs to remain accessible
These decisions affect capture, processing, file format, and delivery.
Good mapping delivery provides context
Producing technically correct files is only part of completing a mapping project.
Someone still needs to understand what the files are, which version is current, when they were captured, and how the individual outputs relate to one another.
That becomes increasingly important as mapping workflows produce more types of data.
An orthomosaic tells one part of the site story.
A point cloud tells another.
A 3D model makes the site easier to interpret.
Images provide detail.
Reports explain methodology and findings.
Supporting files preserve the surrounding project context.
The strongest delivery workflow keeps those outputs connected while preserving the native data required by technical users.
That is the difference between sending files and delivering a mapping project.